MH Energy       Your Better Solar and Energy Partner

Leave Your Message

How to Choose Solar Panels and Batteries in 2026?

Choosing a Solar Panel And Battery system in 2026 requires more than comparing prices and wattage. Your roof, climate, electricity tariff, and daily consumption all shape the right decision. A shaded roof may need fewer, higher-efficiency panels. A sunny roof may benefit more from additional capacity than premium efficiency.

Real performance begins with a site assessment. Measure roof direction, seasonal shading, inverter placement, and available storage space. Then review usable battery capacity, round-trip efficiency, cycle life, warranty terms, and temperature limits. Lithium iron phosphate batteries remain attractive for many homes because of their safety profile and long cycle life. However, chemistry is not the only concern. A poorly sized battery can sit idle or discharge too quickly.

Small details matter.

Fatih Birol, Executive Director of the International Energy Agency, has said, “Solar is becoming the new king of electricity markets.” That shift makes quality and transparency increasingly important. Ask installers for tested product specifications, degradation assumptions, monitoring access, and clear maintenance responsibilities. Compare the system’s expected output with your actual bills, not with optimistic advertisements.

There is no perfect setup. I have seen homeowners overpay for oversized batteries while ignoring evening energy habits. I have also seen low-cost systems create frustration through weak monitoring and complicated warranty claims. A careful 2026 decision should balance resilience, payback, repairability, and future energy needs. Leave room for uncertainty. Weather changes, tariffs evolve, and real consumption rarely matches an online calculator. The best system is practical, documented, and sized for your life.
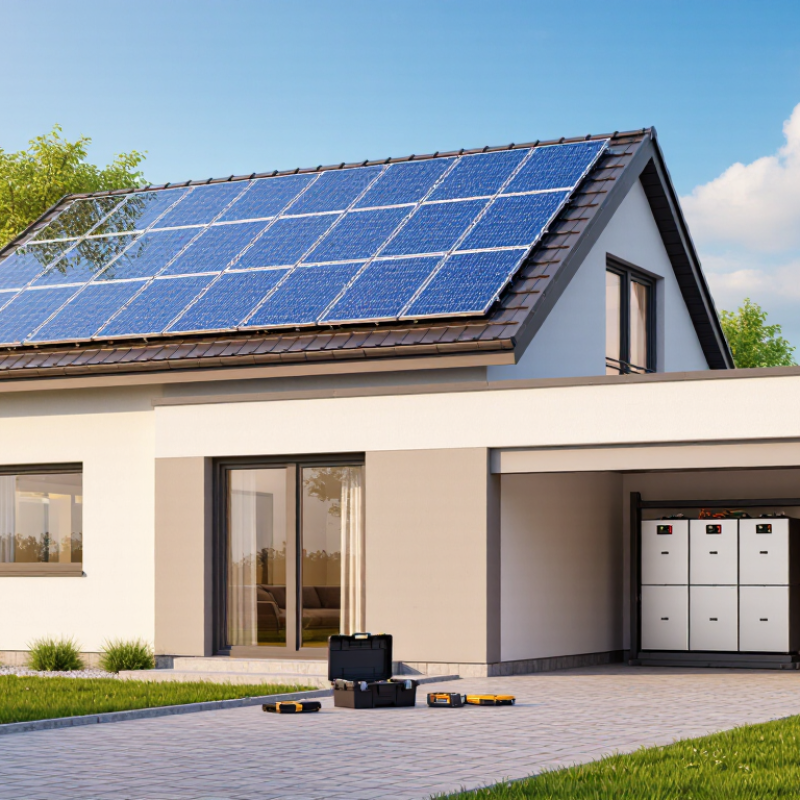
How to Choose Solar Panels and Batteries in 2026?

Assess 2026 Solar Needs: Load Profiles, Tariffs, and NREL Yield Data

Choosing solar panels and batteries in 2026 should begin with your household’s actual load profile, not advertised system size.

Record hourly consumption for several weeks, including air-conditioning, heating, cooking, and electric-vehicle charging. A home using 30 kWh daily may still need a larger battery during evening peaks.

Timing matters.

Compare your load profile with current tariff rules.

The U.S. Energy Information Administration reported an average residential electricity price of about 16 cents per kilowatt-hour in 2024, but local rates vary sharply. Time-of-use tariffs can make evening energy expensive, while demand charges may reward peak reduction. Export credits can also change the payback calculation. Check the utility’s latest tariff sheet, not an outdated sales estimate.

Use location-specific yield data before selecting panel capacity.

The National Renewable Energy Laboratory’s PVWatts tool uses solar-resource and weather datasets from the National Solar Radiation Database to estimate production. Enter roof azimuth, tilt, shading, and temperature losses honestly. A south-facing roof may produce well, but trees can quietly remove meaningful output. NREL modeling is useful, not perfect.

Size batteries around critical loads and tariff periods.

A 10 kWh battery does not provide 10 kWh to appliances after conversion losses and reserve settings. Round-trip efficiency, usable capacity, warranty assumptions, and winter performance deserve scrutiny. My own assessment would include a conservative scenario with cloudy weeks and higher consumption. That less comfortable case is often more realistic. Consult NREL PVWatts documentation and EIA Electric Power Monthly data before final decisions.

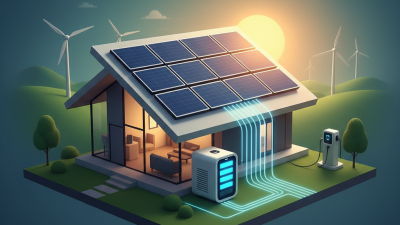
Compare Panels: 20–23% Efficiency and 0.5% Annual Degradation (NREL)

How to Choose Solar Panels and Batteries in 2026?

Solar panels rated at 20–23% efficiency convert more sunlight into electricity within the same roof area. NREL commonly cites about 0.5% annual degradation as a useful crystalline-silicon benchmark. A 400-watt panel may produce roughly 398 watts after one year under similar conditions. Real output changes with heat, dust, shading, wiring, and installation angle. Check the temperature coefficient, not efficiency alone. A panel with slightly lower efficiency may perform better on a hot roof.

I learned this after comparing energy estimates with actual afternoon production. My first estimate was too optimistic. Battery sizing also needs practical measurements. Record evening electricity use, not just your total monthly bill. A battery should cover essential loads without leaving large capacity unused. Compare usable capacity, round-trip efficiency, operating temperature, cycle expectations, and safety certifications. Some systems advertise impressive storage figures, but usable energy can be lower after reserve limits and conversion losses.

Location matters greatly. A shaded chimney can reduce output from several panels, depending on the system design. Ask for a production model using local weather data and your roof’s measured orientation. Review degradation language carefully, because yearly percentages may describe different testing methods. NREL data offers authority, but it does not guarantee one installation’s results. Leave room for uncertainty. Seasonal clouds, future household changes, and imperfect maintenance can alter payback estimates. Reliable decisions come from comparing measured consumption with conservative production forecasts.

How to Choose Solar Panels and Batteries in 2026?

Typical high-performance solar panels are compared across an efficiency range of 20–23%, while annual degradation is shown at 0.5%. Higher efficiency produces more power from the same roof area; lower degradation helps preserve long-term output.

Note: The chart uses representative values within the stated 2026 comparison range. Battery selection should also consider usable capacity, round-trip efficiency, cycle life, operating temperature, and warranty terms.

Size the Array: Roof Area, Irradiance, Shading, and NEC Limits

Roof area is the first hard constraint, not the inverter brochure. Measure usable roof sections after excluding vents, ridges, setbacks, and access paths. A modern module commonly needs about two square meters. Ten modules therefore require roughly 20 square meters, before safety clearances. Lawrence Berkeley National Laboratory’s Tracking the Sun 2024 report found a median U.S. residential system size near 7.4 kW in 2023. That figure is a benchmark, not a target.

Irradiance changes sharply with orientation, tilt, and nearby shade. Use hourly satellite or ground data, rather than annual sunlight averages. NREL’s PVWatts documentation applies a default 14% system-loss assumption, covering wiring, mismatch, soiling, and other losses. Real roofs may perform worse. One chimney shadow can matter more than a perfect spreadsheet. I would model winter shading separately, because low sun creates longer shadows.

NEC limits can stop an oversized design even when roof space remains. Check maximum string voltage during the coldest expected temperature. Then verify conductor ampacity, rapid-shutdown requirements, and the service-panel interconnection rule. The commonly discussed 120% busbar method is not universal; panel ratings, main-breaker position, local code editions, and the authority having jurisdiction matter. Leave documented room for uncertainty. A design that barely passes on paper may fail inspection or require expensive revisions.

Choose Batteries: LFP Safety, 85–95% Efficiency, and BNEF’s $115/kWh

In 2026, battery selection deserves as much attention as solar panel output. Lithium iron phosphate, or LFP, is often preferred for home storage because its chemistry is thermally stable. It also tolerates frequent charging cycles better than several older chemistries. Safer does not mean risk-free. A certified installer should still provide ventilation, temperature monitoring, circuit protection, and clear emergency access. Placement matters. A shaded utility room is usually better than a sealed, sun-heated cupboard.

Efficiency figures need careful interpretation. Manufacturers may advertise 85–95% round-trip efficiency, but real homes lose energy through inverters, cables, standby consumption, cold weather, and battery aging. If a household needs 10 kilowatt-hours overnight, a 10-kilowatt-hour battery may be undersized. I would usually examine at least 11–12 kilowatt-hours of nominal capacity, while preserving the recommended reserve. Bigger is not always wiser.

Cost calculations can also mislead. BNEF’s frequently cited benchmark of $115 per kilowatt-hour helps track falling battery costs, but it is not the final installed price. Labor, controls, wiring, permits, and supporting equipment can change the bill substantially. Ask for both usable capacity and total project cost. Check the warranty terms carefully. One practical lesson is easy to miss: a battery that looks affordable may deliver poor value if the household rarely cycles it. My own planning would include a month of real electricity data, not just a confident estimate. Weather remains inconveniently unpredictable.

Match Capacity and Payback: Backup Hours, Cycles, Warranties, and Incentives

How to Choose Solar Panels and Batteries in 2026?

Choosing a solar system starts with backup hours, not panel wattage. List essential loads, such as a refrigerator, lights, router, medical equipment, and a small pump. Add their running watts, then estimate startup surges. A 10 kWh battery will not deliver 10 kWh to appliances after reserve limits and inverter losses. Measure twice. Keep a reserve for overnight demand and cloudy mornings.

Battery cycle life affects real payback. A daily-cycled battery may complete thousands of cycles, but usable capacity usually declines over time. Check the warranty’s retained-capacity percentage, covered cycle count, calendar period, and throughput limit. These terms can matter more than a long headline warranty. I once estimated backup time using the battery’s nameplate capacity, not its usable output. The result looked excellent, but it was too optimistic. That changed my method.

Match panels to both household use and battery charging needs. Compare annual production, winter output, shading, temperature effects, and inverter limits. A larger array may reduce grid purchases, yet it can lengthen payback if export compensation is weak. Calculate annual savings after maintenance, degradation, financing, and replacement risks. Include local incentives only after checking current government guidance and eligibility rules. Incentives can change during a project. Keep written quotes, warranty documents, and installation records. Small details matter. A professional site assessment should confirm roof condition, wiring capacity, fire access, and realistic backup priorities before purchase.

How to Choose Solar Panels and Batteries in 2026? - Match Capacity and Payback: Backup Hours, Cycles, Warranties, and Incentives
System Profile Typical Daily Load Recommended Solar Array Usable Battery Capacity Approx. Backup Time Battery Chemistry Cycle Expectation Warranty & Payback Considerations
Sizing Scenarios for Common Residential Loads
Essential-load backup 8–12 kWh/day 4–6 kWdc 10–15 kWh 8–16 hours Lithium iron phosphate (LFP) Approximately 4,000–8,000 cycles, depending on depth of discharge and operating temperature Usually the lowest-cost route for backup. Payback improves when it avoids outage losses or replaces expensive peak-time electricity.
Average home with evening use 15–25 kWh/day 6–10 kWdc 15–25 kWh 8–18 hours LFP Approximately 4,000–8,000 cycles Balance battery size against the local peak/off-peak price spread. Oversizing the battery can lengthen payback if daily cycling is limited.
High-load home with heat pump 25–45 kWh/day 10–16 kWdc 25–40 kWh 8–16 hours LFP Approximately 4,000–8,000 cycles Check inverter output, starting loads, winter solar production, and whether the utility allows export of excess generation.
Extended outage resilience 15–30 kWh/day of critical loads 8–14 kWdc 30–60 kWh 24–48 hours LFP or another certified lithium-ion system Approximately 4,000–8,000 cycles Designed primarily for resilience rather than the shortest financial payback. Consider generator integration and seasonal recharge limits.
Panel and Battery Matching Criteria
Solar-panel rated output Residential modules commonly fall within roughly 350–500 W per panel. Actual annual energy depends on location, orientation, shading, temperature, and system losses. Use local solar-production estimates rather than multiplying the nameplate rating by 24 hours. A higher-wattage panel is not automatically better if roof area, inverter limits, shading, or installation cost become the constraint.
Battery usable capacity Usable kWh = nominal battery capacity × permitted depth of discharge. For example, a 20 kWh nominal battery operated to 90% depth of discharge provides about 18 kWh before conversion losses. Compare usable capacity, not only nominal capacity. Leave additional reserve if the system must retain emergency backup energy.
Backup-hour calculation Backup hours ≈ usable battery kWh × inverter efficiency ÷ average backed-up load in kW. An 18 kWh usable battery at 90% inverter efficiency can supply about 16.2 kWh of AC energy. Actual duration changes when refrigerators, pumps, heating equipment, or other loads cycle on and off.
Inverter power rating Choose continuous output for the expected simultaneous load and surge output for motor-starting equipment. Battery energy in kWh and inverter power in kW are different specifications. A large battery cannot run a high-power load if the inverter or backup panel is undersized.
Round-trip efficiency Modern battery-storage systems commonly publish approximately 80–95% round-trip efficiency, depending on the measurement boundary and operating conditions. Higher efficiency reduces energy losses during daily charging and discharging. Compare systems using the same test method; published figures may exclude or include standby and auxiliary consumption.
Battery Life, Warranty, and Total-Cost Checks
Cycle life LFP systems are commonly specified for several thousand cycles; the exact figure depends on depth of discharge, temperature, charge rate, and end-of-life definition. One full cycle per day equals about 365 cycles per year. A battery rated for 6,000 cycles at 90% depth of discharge is not equivalent to one rated for 6,000 shallow cycles.
Calendar life Battery aging occurs even when the system is not cycling. Heat, high state of charge, and long storage periods can accelerate degradation. Review both calendar-year coverage and throughput or cycle limits. A longer warranty is useful only when capacity retention, labor, replacement terms, and exclusions are clearly defined.
Warranty checklist Check years of coverage, minimum retained capacity, cycle or throughput limit, operating-temperature limits, labor coverage, transferability, and installation requirements. Common residential warranty periods are often stated in the range of 10–15 years, but terms vary by product and jurisdiction. Do not compare warranty length alone; compare the total energy delivered during the covered period.
Payback formula Simple payback ≈ net installed cost ÷ annual bill savings and avoided outage costs. Annual savings depend on self-consumption, export compensation, time-of-use rates, battery cycling, and system degradation. Include financing interest, maintenance, inverter replacement, insurance, taxes, and the value of backup power.
Incentive and Regulation Review for 2026
Tax credits or rebates Eligibility, percentage, limits, and start or end dates vary by country, state, province, utility, and tax status. Some programs treat solar generation and standalone storage differently; others require specific installation or ownership conditions. Verify current 2026 rules with the relevant government or utility authority before including an incentive in the payback model.
Net metering or export payment Compensation may be based on retail rates, avoided-cost rates, fixed credits, or time-varying export rates. The export rate directly affects whether adding a battery improves financial returns. Use the current tariff and account for interconnection fees, export limits, and policy changes.
Utility demand or time-of-use programs A battery may reduce purchases during high-price periods or reduce measured demand for eligible customers. Savings depend on dispatch rules, qualifying hours, and whether the utility controls the battery. Confirm enrollment requirements, minimum performance, event frequency, and compensation before relying on program revenue.
Installation and safety requirements Permits, electrical inspection, fire-clearance rules, equipment certification, and interconnection approval may be required. Labor and permitting can represent a significant share of total installed cost. Request an itemized quote covering equipment, labor, permits, commissioning, monitoring, and future service.
Planning note: The figures above are typical engineering ranges and calculation examples, not guaranteed performance. Final sizing should use local solar-resource data, hourly household consumption, the backup-load list, utility tariffs, site conditions, and the applicable 2026 incentive rules.